Intro
This is how to anyone can start making plots with ggplot2 in 2 easy steps. No experience necessary!
Codeschool’s Try R is an easy way to review syntax and learn basic operations. It runs in your browser so you do not need to download R or Rstudio to start learning.
1. Example data
Lets use the famous iris data set as an example. This is data on flowers and their measurements.
library(tidyverse)
Take a glance at the data using the glimpse function.
glimpse(iris)
## Observations: 150
## Variables: 5
## $ Sepal.Length <dbl> 5.1, 4.9, 4.7, 4.6, 5.0, 5.4, 4.6, 5.0, 4.4, 4.9,...
## $ Sepal.Width  <dbl> 3.5, 3.0, 3.2, 3.1, 3.6, 3.9, 3.4, 3.4, 2.9, 3.1,...
## $ Petal.Length <dbl> 1.4, 1.4, 1.3, 1.5, 1.4, 1.7, 1.4, 1.5, 1.4, 1.5,...
## $ Petal.Width  <dbl> 0.2, 0.2, 0.2, 0.2, 0.2, 0.4, 0.3, 0.2, 0.2, 0.1,...
## $ Species      <fctr> setosa, setosa, setosa, setosa, setosa, setosa, ...
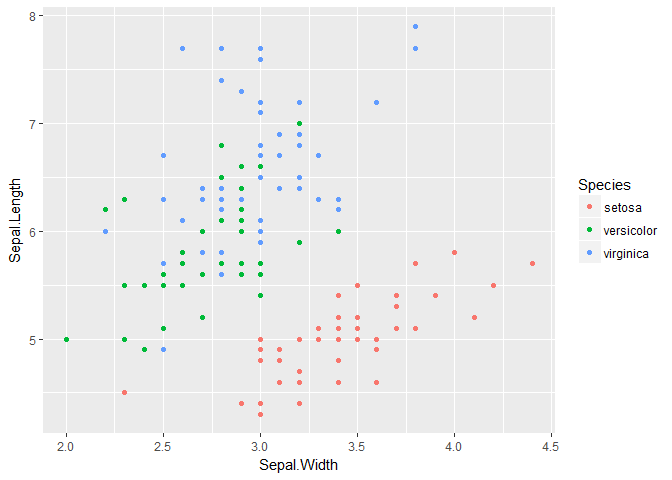
2. Scatter Plot
Lets make a scatter where the sepal length is the y-axis, width is the x-axis, and the species is the colour.
ggplot(iris, aes(y = Sepal.Length, x = Sepal.Width, colour = Species)) +
  geom_point()